Programming Errors and Debugging#
Learning Outcomes#
An understanding of what types of coding errors you might face
How to debug your code to solve errors
Prerequisites#
Errors#
Errors come in a variety of types, some easy to find and fix some more insiduous
Typos
Perhaps the most common errors, where the user mistypes the code they are writing. Can be subtle, remember that Python is case-sensitive. So it is easy to type the wrong variable name with different capitalisation. To minimise typos, try autocompleting your words using the <Tab> key.
This can be controlled by having meaningful variable names that aren’t to long
Example
my_Value = 5
my_value = 90

#Will do a calculation on my_Value
my_Value = my_Value * 50 + 2
#now print my result
print(my_value)
Syntax errors
These are generally the easiest errors to spot. When the code runs the compiler tends to pick up these errors and inform the user. Try putting the following in the box below
    i = 0
    i = 0 + "error"
You should get the following error:
---------------------------------------------------------------------------
TypeError                                 Traceback (most recent call last)
<ipython-input-1-5caa714e6aa5> in <module>()
        1 i = 0
----> 2 i = 0 + "error"

TypeError: unsupported operand type(s) for +: 'int' and 'str'
Though often appearing unintelligble there is a lot of useful information contained in these reports. Perhaps most important is which line is in error (indicated by the ---->) allowing you to at least track it down. If there is ever more than one error it is usually best to start with the first error, often correcting this corrects the others. The error in the code above is that the code is attempting to add a string ('str') to an integer ('int') using the + command (the operand). This is not allowed for +.
Example
my_Value = 5
my_value = 90

#Will do a calculation on my_Value
my_Value = my_Value * 50 + 2
#now print my result
print(my_alue)
Logic errors
These are the most insidious errors and by far the hardest to find. The code will be correct in terms of syntax and will work as written. However the code won’t run as intended. Common places to find this type of error are in conditional statements.
Example:
Imagine we are checking values, if they are less than 10 we want to do something to them that is different to if they are over 10. However, what if we also want something to happen when the value is 5?
We might write the following code
import_test = 5

if import_test <10:
    print("Less than 10")
elif import_test == 5:
    print("This is really important and needs recording")
else:
    print("Over 10")
But this will never trigger the important condition. We check if the value is less than 10, if it is no other checks are peformed. Therefore we will never check if it is 5.
This is correct Python, we have just broken the logic!
Or other common errors are fogetting about the rules for priority of operators in Python, so a calculation is performed that isn’t what you meant:
value = 5 * 3 - 2 * 6
This gives an answer of 3, which might be right if you meant the equation to be \( (5 \times 3) - (2 \times 6)\), but not if you meant \( 5 \times (3 - 2) \times 6 \)
Use brackets in your code to remove any ambiguity, don’t rely on priority
Debugging#
Now we have an understanding of what errors can arise we can look at how to find them in the code and how to fix them Debugging can be done in a variety of ways depending on how you have set up your python installation. If you are just writing your scripts in a text editor and running when done then these following methods can be used
Simple Debugging
Add print statements. When constructing your code add print statements to check that you are getting the values you expect at each step. If you want to see if a condition is being met, add print statements into a condition which says that it has been met. This can lead to an overwhelming amount of outputs
Testing, make sure the bits of code produce the answer ou expect. If there are calculations, do simple examples by hand and then run those examples through your programme. Make sure you get the same answer. If not go look carefully at your code
When writing loops, make sure the code works for a single loop then check it works for 2 etc… build up your complexity.
However, if you use an Integrated Development Environment (IDE) or similar tools. Then as well as the simple methods they will have built in methods that can help track through code for errors, such as break points and linting. We will give examples of how to debug using VScode or Spyder, other IDEs will have similar methods available
Advanced Debugging - VScode
VScode has extensive Python debugging abilities.[ If you are using VScode](/basics/write_run_python.md#installation) you should have the Python extension already installed. If not install it by going to the extensions tab. Which is this icon on the left![]()
Search here for Python and install the Microsoft Python extension. This will give us what we need to get started working with Python in VScode effectively.
To get the most out of VScode it is best to open what is called a workspace. This sounds complicated but just means opening the folder that contains your script file. How to create a workspace and a rationale behind it are here. They are a common concept found in other IDEs, they are very useful.
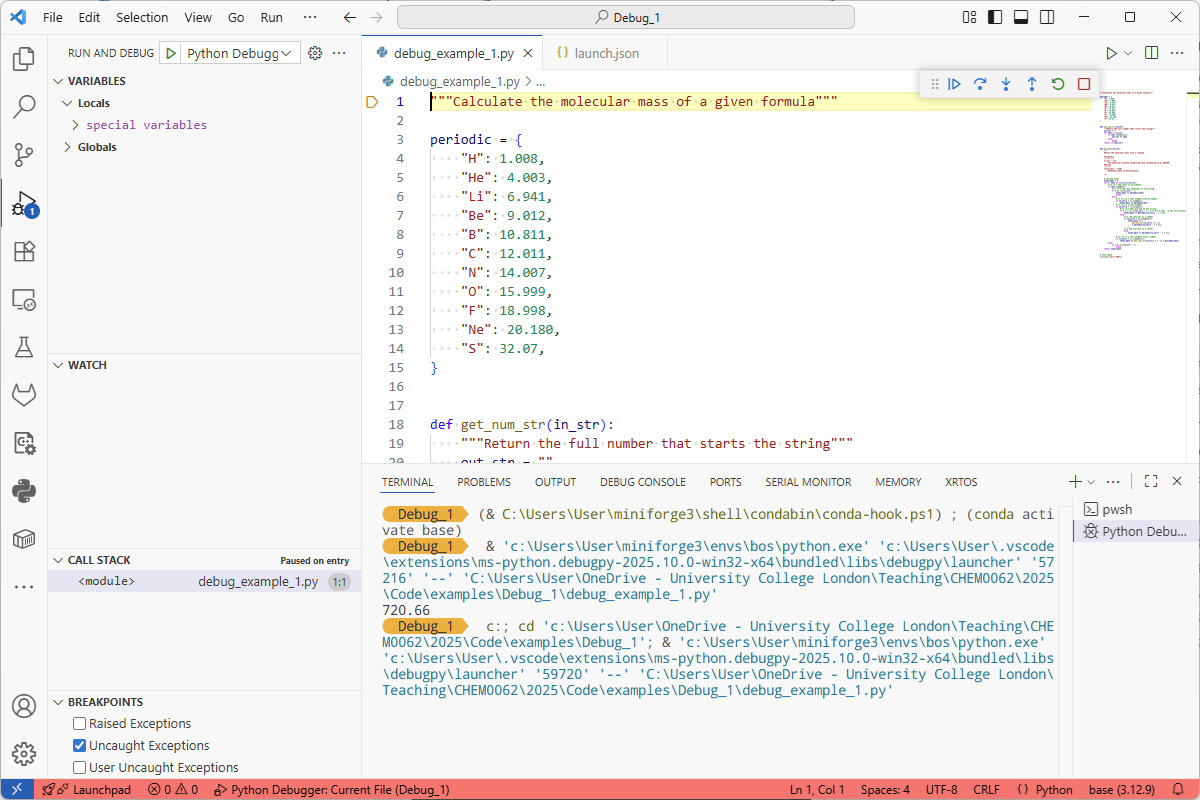
Here is an example workspace opened in VScode:
Currently it is rather sparse as nothing is opened. But we can see the main features, which includes saying that there is a file debug_example_1.py in the workspace. We can open this file by clicking on it.
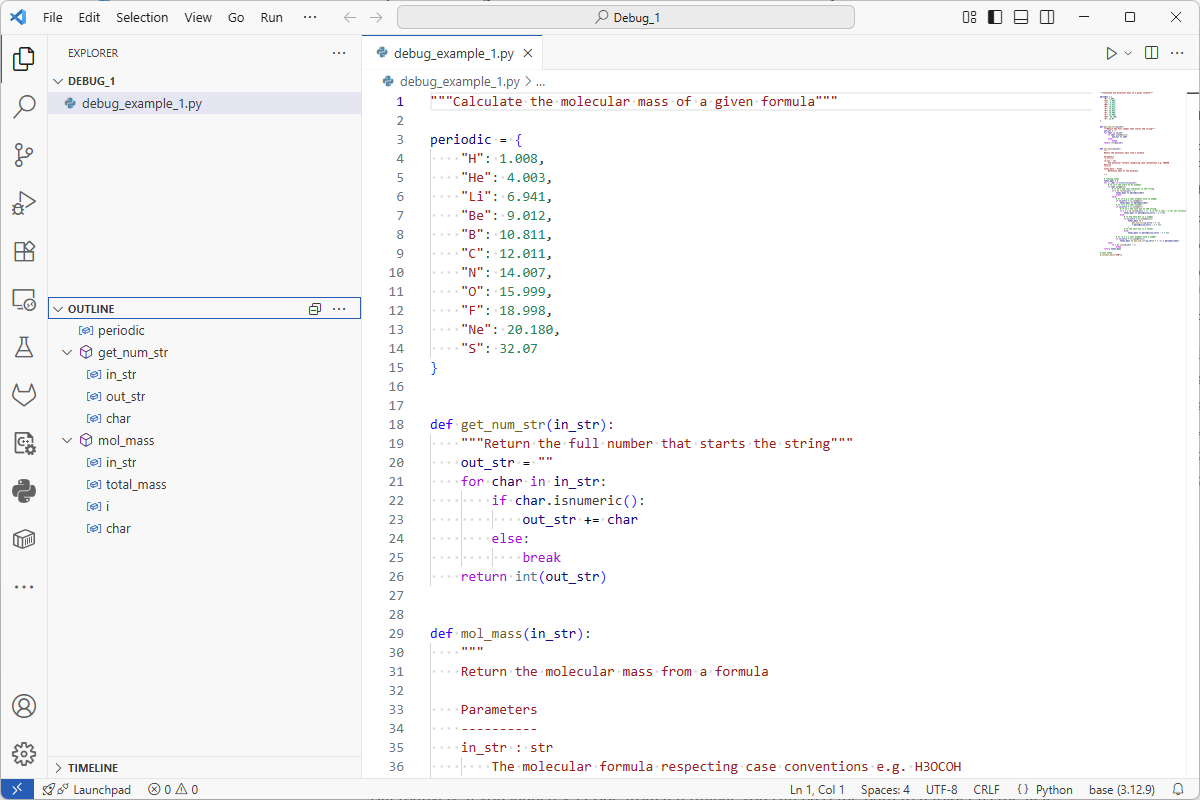 The code is now visible, as is information on the code layout in the outline table on the left. Here the structure of the code is broken down into its functional chunks.
Notice that the code has been coloured to indicate the syntax, i.e what is a variable or a function.
The code is now visible, as is information on the code layout in the outline table on the left. Here the structure of the code is broken down into its functional chunks.
Notice that the code has been coloured to indicate the syntax, i.e what is a variable or a function.
This code will run, but let’s make an intentional error. On line 5 of the code (note that the lines are numbered in the code window to aid navigation) we will remove the second “. This is a breaking change.
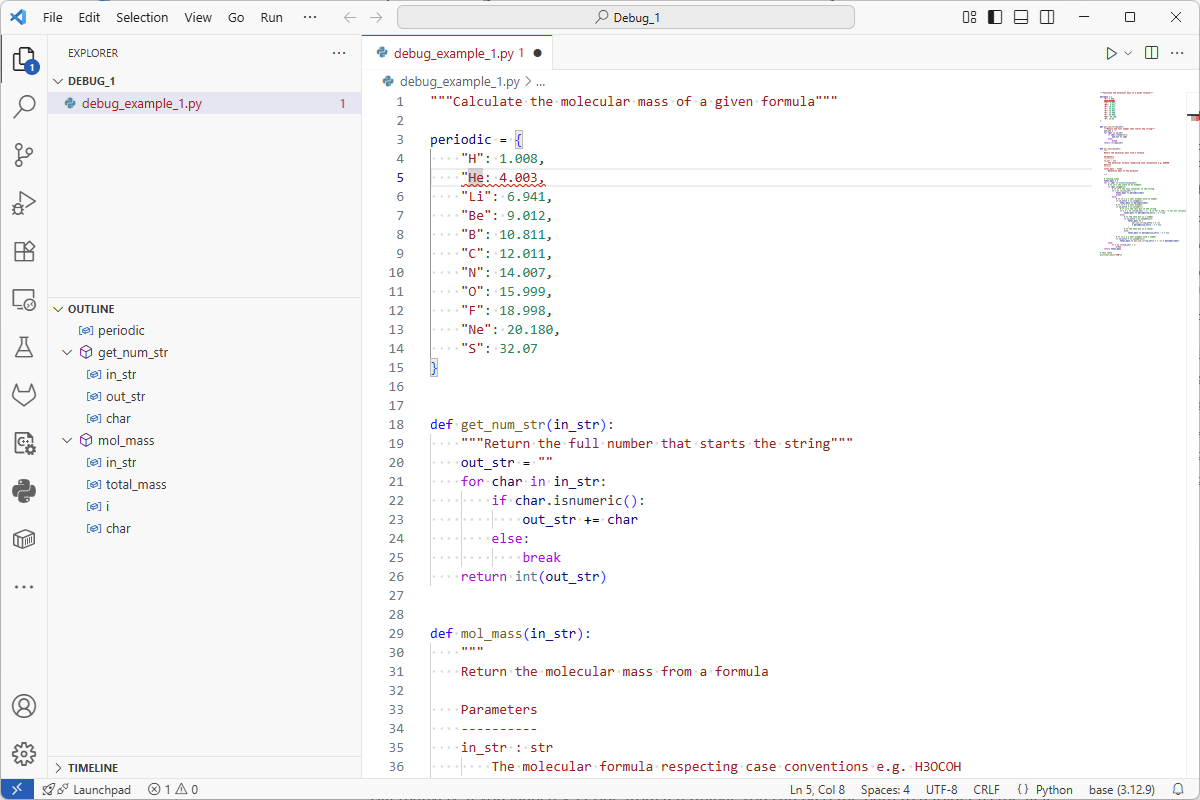
Notice that the line with the broken code is now underlined in red, indicating the error. If I hover the mouse over the error a pop up will explain the error.
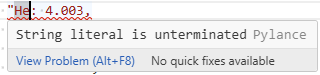
I can now fix this error by terminating the string literal, i.e putting the “ back in place.
How do we run the code to test. The first way is to run it in an integrated terminal. Got to the terminal menu and choose New Terminal. A new terminal will open in the bottom of the window. We can then run our programme by typing the following command:
python debug_example_1.py
and the output is then written to screen
Useful, but we can do it better than that. We can run in debug mode.
To do this we go to the debug tab
![]()
Then we can either click the Run and Debug button or the create a launch.json file link. I would click the link over the button as it makes the steps quicker in future as your choices are saved. Once clicked a little choice window will appear

select the Python Debugger then in the next selection choose Python File, there are lots of other options available but they are more advanced and beyond the scope of this lesson. This has now created a launch.json files which can be edited to control how the debugger works. It is good to add an extra option "stopOnEntry":true
Adding this makes the final launch.json look like this (note the comma on the line before the stopOnEntry)
{
    // Use IntelliSense to learn about possible attributes.
    // Hover to view descriptions of existing attributes.
    // For more information, visit: https://go.microsoft.com/fwlink/?linkid=830387
    "version": "0.2.0",
    "configurations": [

        {
            "name": "Python Debugger: Current File",
            "type": "debugpy",
            "request": "launch",
            "program": "${file}",
            "console": "integratedTerminal",
            "stopOnEntry":true
        }
    ]
}
Now either press F5 or the green play button in the debug tab to start debugging (make sure the file you want to debug has the focus in the document window)
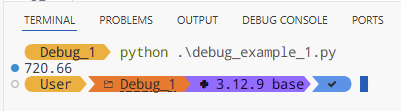
The top line is highlighted in yellow, this indicates that the execution of the code is stopped on that line. In the top left is a set of debug controls
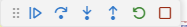
If we press the green button the code will run until the next set breakpoint, the other icons allow the code to be stepped through a line at a time. We can set a breakpoint, that is a section of code the debugger will stop on (that is break), by clicking to the left of the line number we want to stop on. We shall do this on line 83, which is where the programme proper starts.
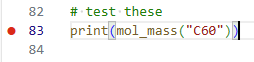
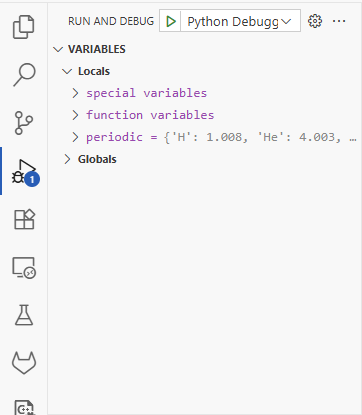
Notice the red circle, this is the set breakpoint. Now press the green play button in the debug controls. The programme will stop and highlight line 83. If you look in the Debug tab the Variables list is now populated.
Next press the third icon (the circle with an arrow pointing to it), this is step into and will take us to the next line of code.
Use of breakpoints and the variables in the debug tab will allow you to easily step through code and find where a calculation is not working quite how you expect.